|
|
|
|
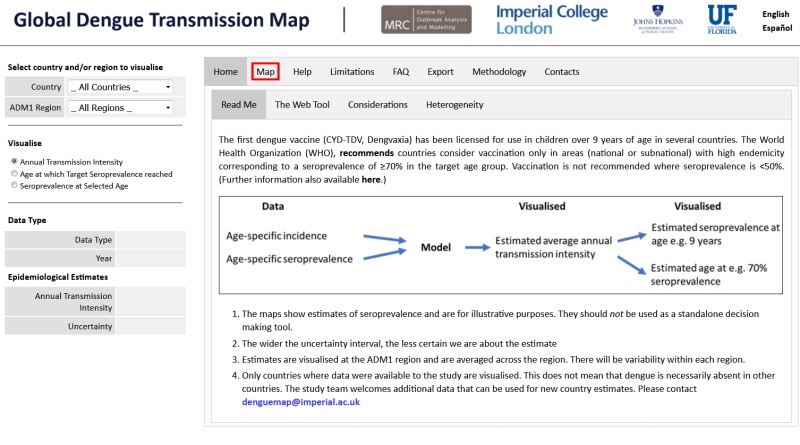
The first dengue vaccine (CYD-TDV, Dengvaxia) has been licensed for use in children over 9 years of age in several countries. The World Health Organization (WHO), recommends countries consider vaccination only in areas (national or subnational) with high endemicity corresponding to a seroprevalence of ≥70% in the target age group. Vaccination is not recommended where seroprevalence is <50%. (Further information also available here.)
- The maps show estimates of seroprevalence and are for illustrative purposes. They should not be used as a standalone decision making tool.
- The wider the uncertainty interval, the less certain we are about the estimate
- Estimates are visualised at the ADM1 region and are averaged across the region. There will be variability within each region.
- Only countries where data were available to the study are visualised. This does not mean that dengue is necessarily absent in other countries. The study team welcomes additional data that can be used for new country estimates. Please contact denguemap@imperial.ac.uk
As seroprevalence data are not available in many parts of the world, this tool was developed to provide additional information to countries considering introduction of the dengue vaccine as part of their dengue prevention and control strategy.
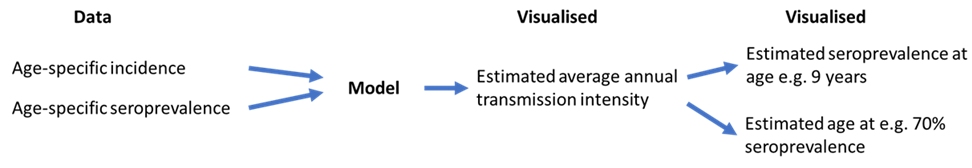
The tool can be used to visualise estimates of dengue transmission intensity derived from
- age-stratified data on dengue seroprevalence (from journal publications - PMIDs can be exported)
- age-stratified data on dengue incidence (from publically available country case data - see Methodology)
These estimates are then used to calculate the expected seroprevalence at subnational levels for several countries, and how it relates to the WHO recommendations (for full details see Methodology). The uncertainty around the estimates gives a likely range within which the true seroprevalence lies - the wider this interval, the more uncertain we are about the estimate (see FAQ). Thus, the maps can help identify areas of low or high average seroprevalence and can also help to identify areas where data are not yet available and areas which may benefit from having transmission intensity estimates.
The expected seroprevalence levels shown here are estimated values and are only intended for illustrative purposes - and as one factor out of many that may inform country-level decision making. Other important factors that go into country decision-making about vaccination include
- consideration of local priorities,
- national and subnational dengue epidemiology as measured by a variety of means,
- predicted impact and cost-effectiveness of a vaccination program,
- feasibility of a vaccination program,
- affordability and budget impact.
Thus, the provided estimates should not be used on their own for deciding whether or not to introduce dengue vaccination as part of a public health programme. The estimates presented here are also not intended to be used by individuals deciding whether or not to get the Dengvaxia vaccine.
Currently estimates are visualised at administrative level 1 and are averaged across the region. Therefore even if administrative units appear suitable for vaccination (seroprevalence >70%), there may be areas within these units which will have <50% seroprevalence and therefore are ill-suited for vaccination. This is due to the known heterogeneity of dengue transmission within regions (shown below - heterogeneity in force of infection estimates between subdistricts within the same district of Mueang Rayong).
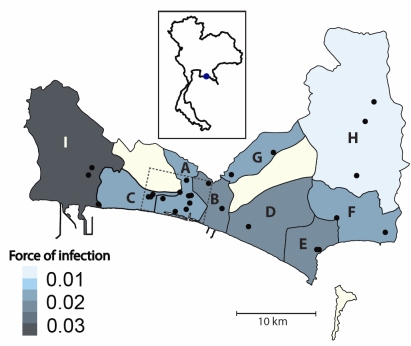
Fig 1: Estimated λ(t) (serotype-specific forces of infection) for the 9 subdistricts of Mueang Rayong, Thailand, represented in the 2010 serological study. Locator map shows the location of Mueang Rayong district (blue point) within Thailand. Results show significant heterogeneity in λ(t) among subdistricts. A) Tha Pradu, B) Choeng Noen, C) Noen Phra, D) Taphong, E) Phe, F) Klaeng, G) Na Ta Khuan, H) Ka Chet, and I) Map Ta Phut. Reproduced from Rodriguez-Barraquer et al. (2014) Am. J. Epidemiol. |
For additional discussions of the limitations, please see the Methodology page.
Click the Help tab for more details, or a detailed user guide is available here.
|
Summary:
The first dengue vaccine (CYD-TDV, Dengvaxia) has been licensed for use in children over 9 years of age in several countries. The World Health Organization (WHO) recommends countries consider vaccination only in areas (national or subnational) with high endemicity corresponding to a seroprevalence of ≥70% in the target age group. Vaccination is not recommended where seroprevalence is <50% (Table 1).
| Seroprevalence in target age group (9 years+) | Is vaccination recommended? |
| ≥70% | Yes |
| 50-70% | Maybe |
| <50% | No |
In order to provide some guidance to countries considering vaccine implementation, we have used estimates of transmission intensity of dengue derived from a) age-stratified data on dengue seroprevalence and b) age-stratified data on dengue incidence to estimate the expected seroprevalence at subnational levels for several countries. Specifics of the data used for each country/setting are provided in Table 2, and in N. Imai et al (2015).
The seroprevalence at age 9 was calculated assuming a constant force of infection and a simple catalytic model:
z(9) = 1-e-foi*no.serotypes*9
where z(9) is the seroprevalence at age 9, foi is the force of infection or transmission intensity, and no.serotypes is the number of dengue serotypes in circulation in that region. Based on the force of infection estimates, the age at which seroprevalence would reach the 70% threshold ( Age[0.7]) was then estimated by:
| Age[0.7] = |
-log(1-0.7) |
|
| (foi*no.serotypes) |
Here we have assumed that all four serotypes are in circulation. For further reading and a detailed explanation on the methodology, see Imai. N et al. (2015). If you require a more detailed explanation of the incidence model estimates, please contact Dr. Isabel Rodriguez-Barraquer.
This tool was developed in order to visualise currently available estimates of dengue transmission intensity (force of infection) and seroprevalence, and the suitability for dengue vaccination with CYD-TV.
The CYD-TDV vaccine is currently licensed for use in several countries in Asia and the Americas. We are hoping to generate more estimates to aid countries considering introducing it.
If you have data (age-stratified seroprevalence or age-stratified incidence data) from one of the countries listed above or from a country considering introduction of Dengvaxia®, and are willing to share these data with us please contact: denguemap@imperial.ac.uk
Acknowledgements
Contacts
| The Model | Dr. Isabel Rodríguez-Barraquer 1 |
| Dr. Natsuko Imai 2,3 |
| Dr. Derek Cummings 4 |
| Prof. Neil Ferguson 2,3 |
| Web Tool | Dr. Wes Hinsley 2,3 |
| 1 |
Infectious Disease Dynamics, Johns Hopkins Bloomberg School of Public Health
|
| 2 |
WHO Collaborating Center for Infectious Disease Modelling
| | 3 |
MRC Centre for Outbreak Analysis and Modelling, Imperial College London
|
| 4 |
Department of Biology and Emerging Pathogens Institute, University of Florida
|
Download Estimates:
Please cite this website (https://mrcdata.dide.ic.ac.uk/_dengue/dengue.php) if reproducing these estimates.
N.B - The transmission intensity and corresponding expected seroprevalence levels are estimated values and are only intended for guidance purposes. They should not be used on their own for decision making purposes. Currently estimates are visualised at admin unit 1 levels, however there will be considerable heterogeneity within each region.
Download
Help:
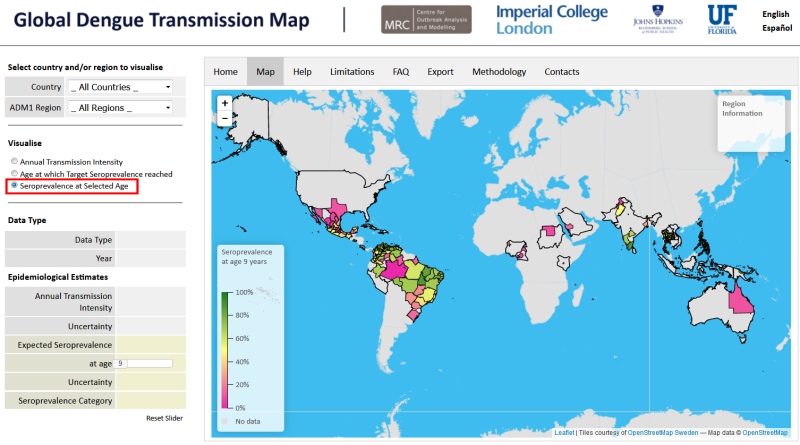
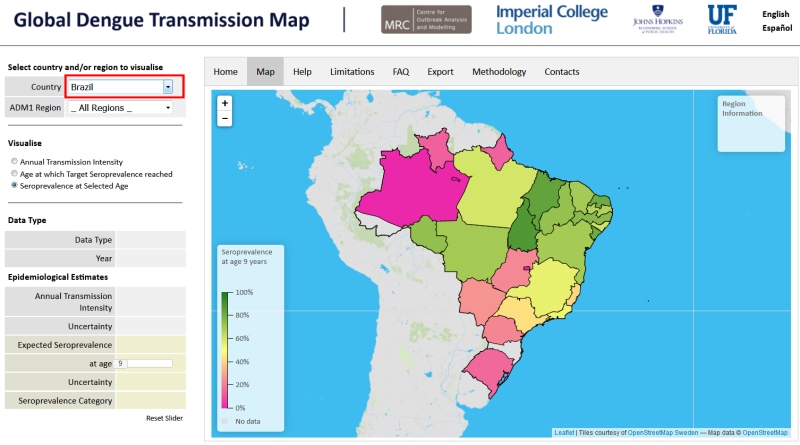
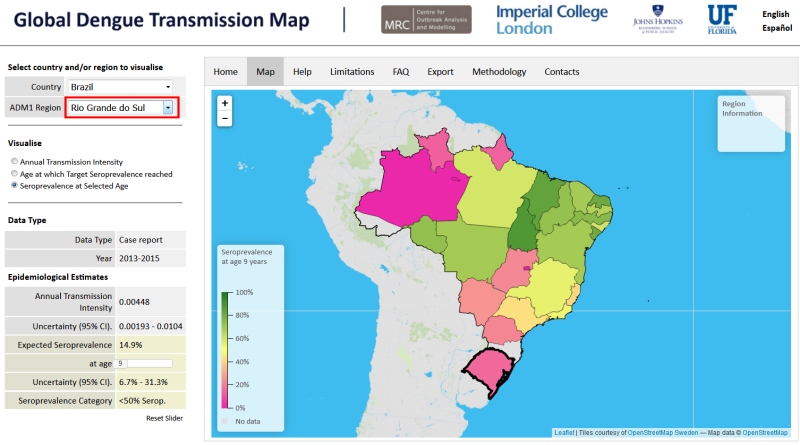
Country dropdown menu will highlight and visualise the country of interest. The administrative unit 1 region can also be selected, either by clicking on the map or from the dropdown menu, to visualise a specific area of interest. This will populate the tables on the left-hand side showing information about:
- Data Type: whether the underlying data are from seroprevalence surveys ('Serology') or from incidence data ('Case Report').
- Year: the relevant year(s) the data were collected from.
- Annual transmission intensity: the annual force of infection for a single serotype (per capita rate susceptibles acquire infection) averaged across the administrative unit, and the uncertainty around this estimate ('Uncertainty'). e.g. annual transmission intensity in Minas Gerais, Brazil = 0.0224. Therefore, on average, 2.2% (1-e-0.0224) of susceptible individuals are infected by a single serotype per year.
- Expected seroprevalence at age X: given the annual transmission intensity, the expected seroprevalence reached at age X, where X can be chosen using the slider. The uncertainty around the expected seroprevalence is also shown ('Uncertainty').
- Seroprevalence Category: the category the estimated seroprevalence falls into (<50%, 50-70%, and >70%).
- Age at which expected seroprevalence is X: given the annual transmission intensity, the age at which the population reaches a seroprevalence of X%, where X can be chosen using the slider. The uncertainty around the expected age is also shown ('Uncertainty').
The sliders can be reset to their original positions (9 years and 70% seroprevalence) by clicking 'Reset Sliders'.
The uncertainty around the estimates are either 95% confidence intervals or 95% credible intervals for estimates based on 'Case Report' data and 'Serology' data respectively.
Detailed user guide available here.
Frequently Asked Questions:
There are a number of limitations associated with the estimates presented here which should be taken into account when considering vaccine implementation. Some serological surveys used to estimate the transmission intensity in some areas have been conducted in specific cities, towns, or communities and therefore may not be representative of the whole administrative unit. Conversely, the case notification data are aggregated at the admin 1 unit level and represent the average transmission intensity in the admin unit. In both cases, the estimates presented represent averages, and do not capture the heterogeneity that might exist within each administrative unit. Transmission of dengue is known to be heterogeneous even at small spatial scales, so it is expected that significant heterogeneity (e.g., variations in the force of infection and seroprevalence) may exist in some administrative units. The results presented here represent the best estimates from the currently available data. Estimates at finer spatial scale (for example admin 2 units) can be produced for settings where the data is available at this administrative level.
In the conversion of force of infection to: i) estimated seroprevalence at a specific age and ii) estimated age at which a specific seroprevalence is reached we assume that the force of infection is constant. While assuming a constant force of infection for short periods of time (e.g., <10 years) may be reasonable for most settings, this assumption may lead to biased results over longer periods of time. This is particularly true for settings where dengue is known to have re-emerged recently.
Similarly, this assumption will not capture seasonality or the cyclical nature of dengue transmission. Nevertheless, it will still give the best average estimate over a period of time.
|